- Home
- /
- solutions
- /
- Technical and Vocational Training Equipment
- /
- IC Engine
- /
- PC Based Data Acquisition System for IC Engine Test Rig
PC Based Data Acquisition System for IC Engine Test Rig
Model - HMT12
Products

Description
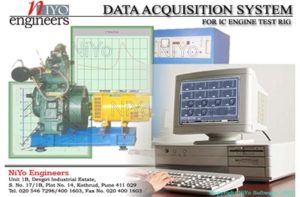
NiYo Engineers’ Computer Based Data Acquisition System for IC Engine Test Rig can be hooked up with minimum efforts to an existing Engine Test Rig in your lab. All the necessary instrumentation and software is supplied. The software is Windows based extremely user friendly. The data acquired, the data analysed and its calculations can be viewed in a tabular and/ or graphical form. Various graphs can be viewed e.g. hbth v/s fuel consumption, rpm v/s BP, etc. The software also permits printing of the various data/screens and engine speed. Testing can be carried out at various loads.
There is a facility to plot P-Theta and P-V Diagram on PC. Heat release rate can also be calculated.
Instrumentation is supplied to measure various parameters like, temperature, fuel consumption, air flow rate measurement, load, engine speed, etc. Testing can be carried out at various loads.
Topics covered are,
- To determine Brake Power
- To determine engine volumetric efficiency
- To determine engine brake thermal efficiency
- To determine engine specific fuel consumption
- Complete energy balance using exhaust gas calorimeter.
- Determining air-fuel ratios
- Morse Test
- P-Theta and P-V diagram
- Heat release rate
Components
Torque Transducers, 1 no.
Energy meter transmitter, 1 no.
Engine Fuel Consumption meter, 1 no.
Air Flow Intake Measurement, 1 no.
Temperature Sensor, 5 no.
Transmitter, 2 no.
Speed Transmitter, 1 No.
Data Interface Module, 1 No.
Engine Indicating System Consisting of,
- Piezo type pressure sensor to measure cylinder pressure
- Crank Angle Marker
- Fast data acquisition module and Software for Windows
Engine cooling and Calorimeter cooling water flow measurement, 1 no. each
Computer
Software with single user license, facilitating, 1 no.
- Acquired data display (Tabular / Graphical form)
- Analysed data display (Tabular / Graphical form)
- Plotting of various curves
- Programmed calculations for the analysis of the acquired data
- Related theory and comprehensive help

